Last modified 09/01/2022 by TJS.
Overview
Data can help inform instructional decisions. HuskyCT has a number of data collection and reporting tools for instructor use. In addition, media tools, such as YouTube, Mediasite, and Kaltura often have data reporting features.
This post addresses the following questions you may have as an instructor.
- Which students are active and inactive in my course? (Topic: Student Activity)
- How did the class (collectively) perform on an assessment? (Topic: Class Performance)
- How is a particular student performing in the course? What students are at risk or struggling in the course? (Individual Student Performance)
- What are the students’ activity patterns in the course? (Topic: Course Activity & Patterns)
- Are students watching my lectures and videos? (Topic: Viewing Patterns)
Which students are active and inactive in my course? (Topic: Student Activity)
The Performance DashBoard captures student activity. It identifies the last time a student accessed a course, days since the student last logged in, and the number of discussion posts the student has made, among other data.
Uses: Identify and contact inactive students early in the course to ensure there are no access issues. If a student has not logged into the course, use contact information that is external to HuskyCT, such UConn email, telephone, etc. Throughout the course, use the data to identify inactive students needing prompting and encouragement.
How did the class (collectively) perform on a graded item? (Topic: Class Performance)
The Grade Center provides a wealth of class performance information. Depending on the type of graded item, different statistical data is available.
| Graded Item Type | Column Statistics (statistic for a grade item) |
Attempt Statistics (results overall & by question) |
Item Analysis (effectiveness of questions & assessment) |
| Discussion Forums | X | ||
| Assignments | X | ||
| Quizzes, Tests, Exams | X | X | X |
Uses: Determine what objectives are being achieved and not achieved overall and where instructional interventions are needed. Interventions may include: further or alternative instruction, future course design revision(s), and/or an evaluation and revision of an assessment.
How is a particular student performing in the course? What students are at risk or struggling in the course? (Topic: Individual Student Performance)
The Grade Center provides a snapshot of a student’s performance by graded item. You can also run Reports in the Grade Center to get an overall picture of a student’s performance. If you need further supporting student activity data to compare with performance information, run a “Course Activity Overview” Course Report. To specifically identify at risk students, use the Retention Center.
Uses: Determine which students may need further assistance or a conference to help them take action. Use information as progress reports for all students. Consider highlighting high achievers.
What are the students’ activity patterns in the course? (Topic: Course Activity & Patterns)
Generate Course Report to view information about course usage (frequency) and activity (patterns). Important Note: Course reports data is built off of student hits. It doesn’t necessarily mean students engage with the elements they are clicking.
Uses: Combine with other performance data to help struggling students. Use when making course design revision decisions. For example, keep elements students accessed frequently and question course elements infrequently used by students.
Are students watching or listening to lectures and videos? (Topic: Media Viewing Patterns)
Mediasite: Mediasite’s video analytics and reports show who is watching what and when. It provides data to help understand viewing behaviors, measure your content’s impact and value in order to make well-informed decisions.
Youtube: YouTube Analytics lets you monitor the performance of your channel and videos with up-to-date metrics and reports.
Kaltura: Kaltura gathers information about student interaction with videos. To access these data, do the following:
– Go to your Kaltura Library
– Click on the recording
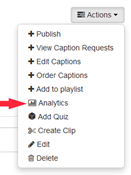
– Click Actions-Analytics
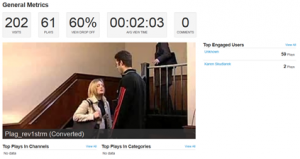
You will see the General Metrics for the recording as shown below:
Other: There are many different video, audio and media options available (external to HuskyCT). Search for the available analytics information on the provider’s website.
Uses: Along with other student performance data, analyze the effectiveness of videos by examining viewer behavior, as it relates to duration, views of single videos, drop-off rate, and the viewing trends of videos over the semester timeframe. You can use the data to consider adjusting video length, content, engagement strategies, and overall value of videos.
Related Topics
- Evaluating Teaching and Course Design using Surveys
- Mediasite Tips and Examples

